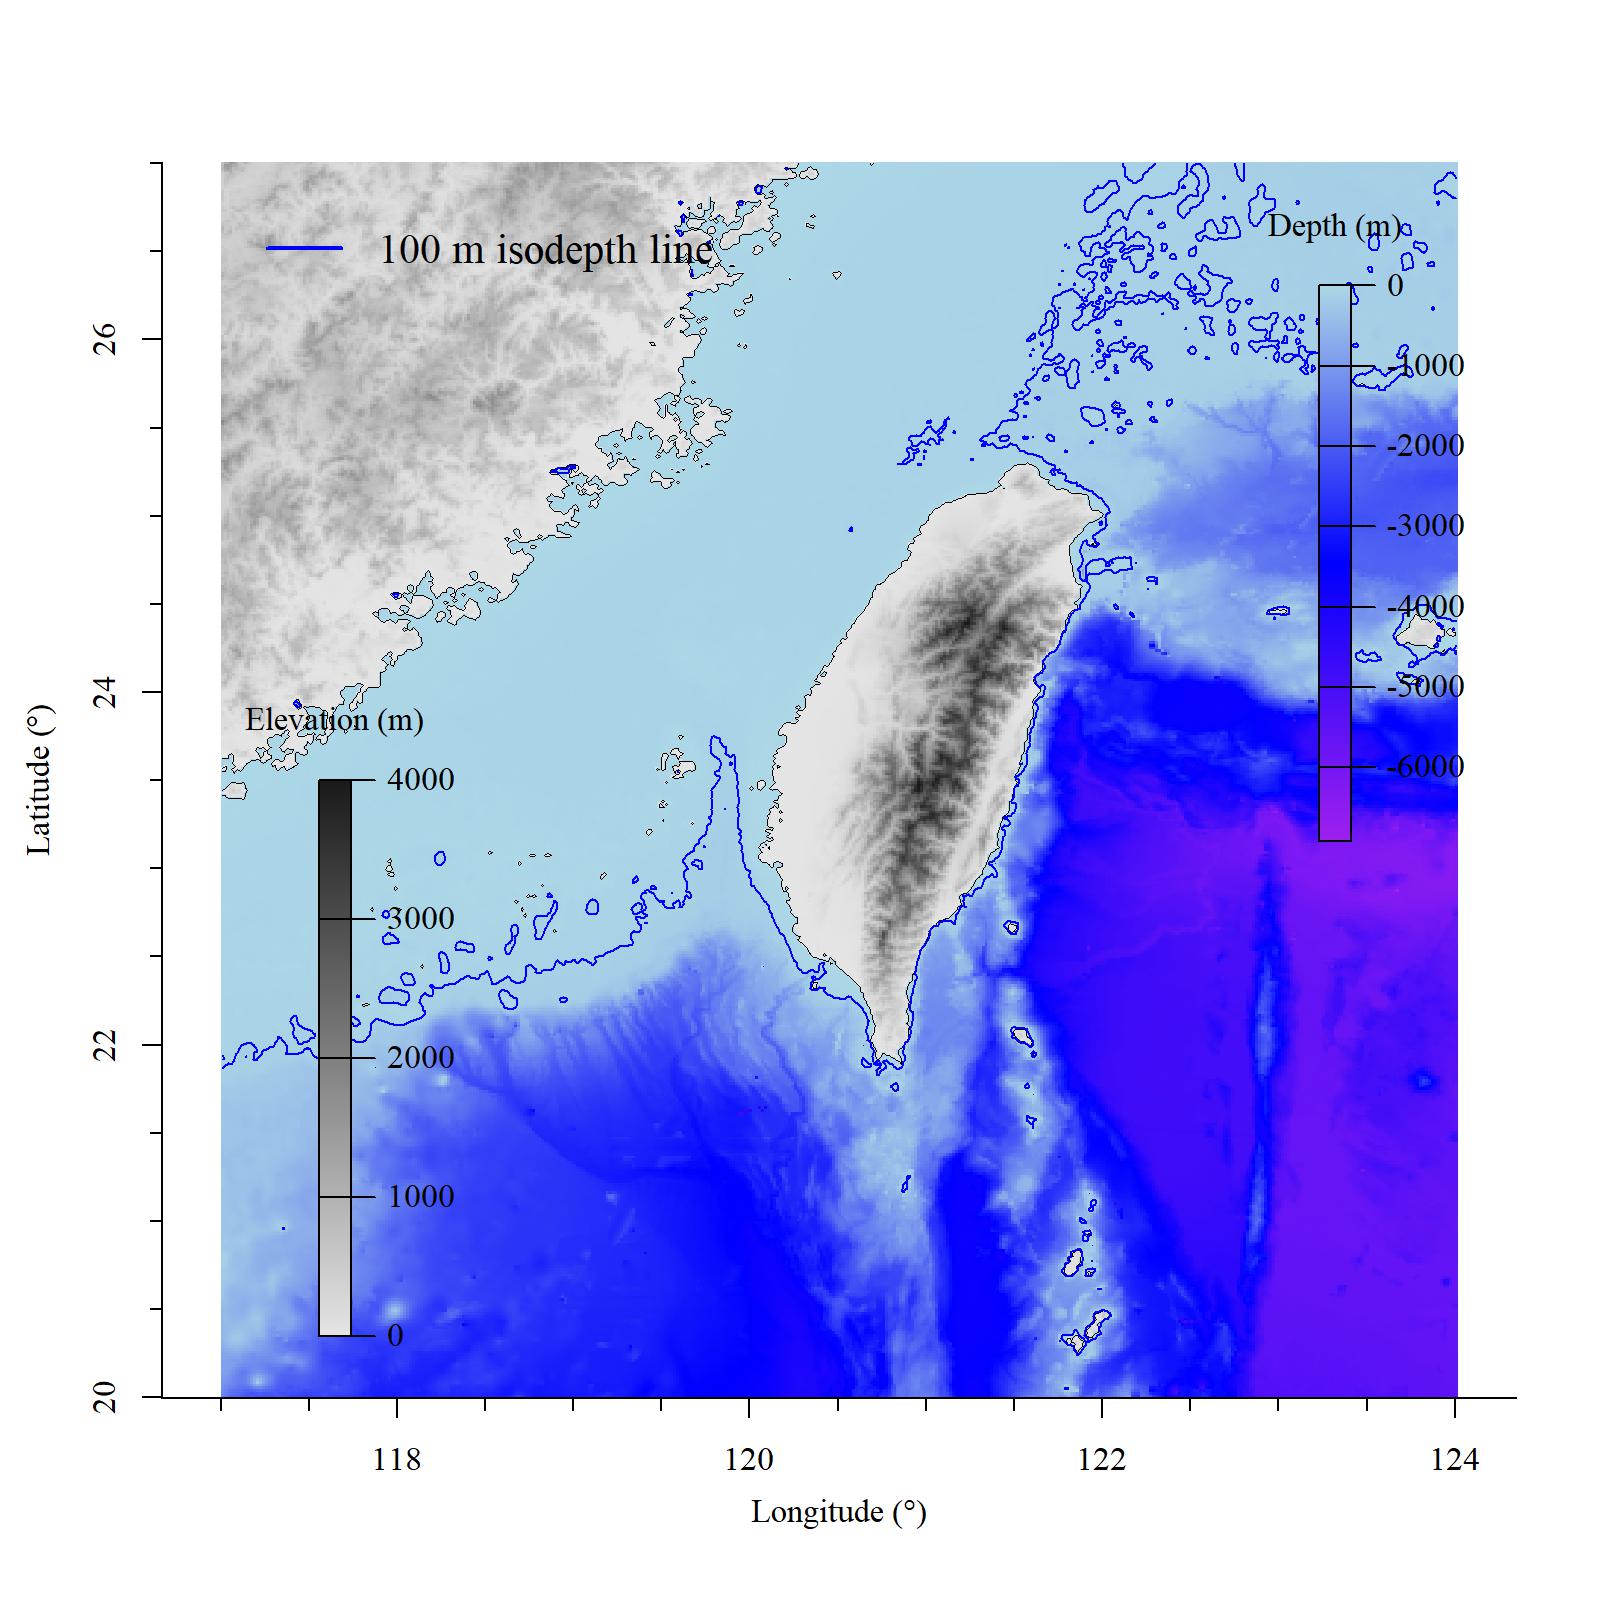
許多水文資料,都可以在網路上得到,再應用開放軟體的套件,就可以做出漂亮的圖。我還沒想到,不到兩個小時,就可以完成台灣附近海域的海底地形圖,也順便做了個海溫分析。首先我去全世界地形資料庫(Smith and Sandwell, 1997),輸入想要的範圍後,就可以輕鬆取得經緯度以及高度的資料(XYZ data)。利用統計軟體R及marmap套件,不到30行的指令,就可以做出下圖:
In recent days, it is easy to obtain detailed information through web-sites. Then by applying the packages in the open-source software, it takes me less than 2 hours to finish these plots and analysis, quite surprising. At first, i visit the website "Extract topography", which provides longitude, latitude, and altitude for selected range. The by using the statistical software R and package "marmap", i make following bathymetric map in less than 30 lines
從上圖而知,台灣海峽相對算淺的,大多都在100m以淺。在澎湖和嘉義間有條較深的海洋低谷,然後在高雄外海就有比較深的大陸波。然而在東部有夠深,出去沒幾下子就超過3000m,一直到宜蘭中部才比較淺。也難怪大溪漁港會有那麼多的深海魚。
We can see that Taiwan Strait is relatively shallow, mostly less than 100 m. At the east of Pong-Hu Islands there is a deeper valley, and waters offshore Kaoshung has also a deeper slope. On the other hand, there is a extreme steep slope at the eastern Taiwan. It can go up to 3000 m in a couple of 10 km offshore. Only until to the northern Taiwan the bottom becomes relative shallower. That is also the reason that the trawlers operating around this water catch a lot of deep-sea fishes.
接下來去很威的美國國家海洋與大氣署的全球每日海表層水溫資料庫 (NOAA OISST database),來擷取上圖台灣附近的每日表層海溫,再去做每月的平均:
Then I obtain the daily sea surface temperature of waters around Taiwan from NOAA OISST database, and calculate the monthly mean value:
基本上,相對於東邊的深處,台灣西北邊有相對劇烈表海溫季節差異。然後,為了好玩,我做了一個動畫,表示台灣附近海域從2010年一月到2017年10月表水溫的變化。
Compared to the deeper eastern Taiwanese waters, the northwestern part of Taiwan exhibits stronger seasonal contrasts. Out of fun, i make a gif animation on the monthly sea surface temperature of waters around Taiwan from January 2010 to October 2017.
最後,計算出1982~2016的每月長期資料,和同時期阿拉伯灣西部,沙烏地海域的表水溫做比較:
Lastly, i calculate the average monthly SST from 1982 to 2016 for waters around Taiwan, and compare those values with the western Arabian Gulf, the Saudi Arabian territorial waters in the Gulf:
台灣附近海域,相對於阿拉伯灣西部,有比較穩定的季節性海水溫。西部阿拉伯灣的環境,比台灣要更極端,最高溫較高,最低溫也較低,同時每月的溫度變化也較台灣高。
Compared to the western Arabian Gulf, the waters around Taiwan have relatively stable in terms of SST. The western Arabian Gulf exhibits more extreme environment, with higher monthly maximum, and lower monthly minimum, as well as higher variation within a month.
這些圖我想應該還粗糙的,但主要想表達原來開放資料和開源軟體這麼強大。以前可能要用很專業的付費軟體分析,但是現在用網路上的可靠資源,就可以在短時間內做出很不錯的結果。Although these plots may be still rough, it is still very incredible that one can use open-source data and freeware, instead of paid professional software, to make such interesting figures!
In recent days, it is easy to obtain detailed information through web-sites. Then by applying the packages in the open-source software, it takes me less than 2 hours to finish these plots and analysis, quite surprising. At first, i visit the website "Extract topography", which provides longitude, latitude, and altitude for selected range. The by using the statistical software R and package "marmap", i make following bathymetric map in less than 30 lines
 |
| Bathymetric map for waters around Taiwan 台灣周圍海底地形圖 |
We can see that Taiwan Strait is relatively shallow, mostly less than 100 m. At the east of Pong-Hu Islands there is a deeper valley, and waters offshore Kaoshung has also a deeper slope. On the other hand, there is a extreme steep slope at the eastern Taiwan. It can go up to 3000 m in a couple of 10 km offshore. Only until to the northern Taiwan the bottom becomes relative shallower. That is also the reason that the trawlers operating around this water catch a lot of deep-sea fishes.
Then I obtain the daily sea surface temperature of waters around Taiwan from NOAA OISST database, and calculate the monthly mean value:
 |
| 2017 February Sea surface temperature 2017年二月台灣海表水溫圖 |
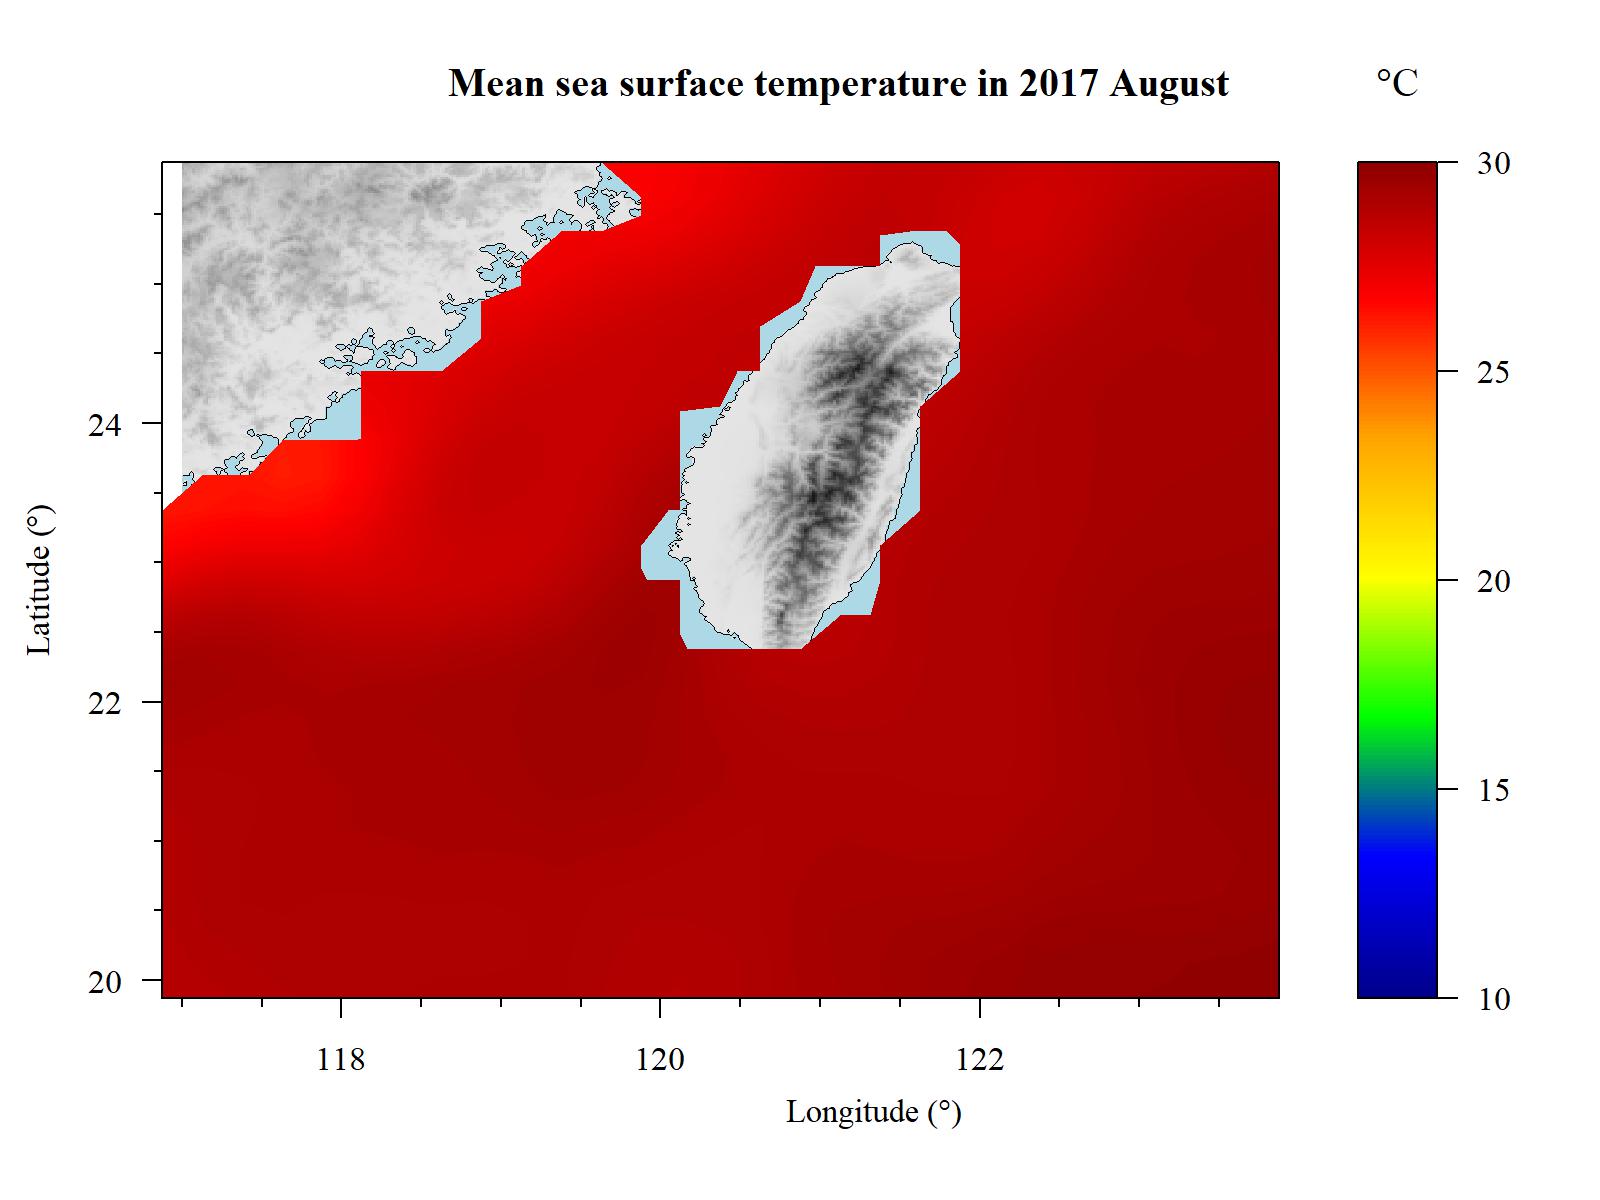 |
| 2017 August Sea surface temperature 2017年八月台灣海表水溫圖 |
基本上,相對於東邊的深處,台灣西北邊有相對劇烈表海溫季節差異。然後,為了好玩,我做了一個動畫,表示台灣附近海域從2010年一月到2017年10月表水溫的變化。
Compared to the deeper eastern Taiwanese waters, the northwestern part of Taiwan exhibits stronger seasonal contrasts. Out of fun, i make a gif animation on the monthly sea surface temperature of waters around Taiwan from January 2010 to October 2017.
 |
| Monthly changes in SST of waters around Taiwan from Jan 2010 to Oct 2017. 2010年一月至2017年十月台灣附近海域每月海表溫的變化圖 |
最後,計算出1982~2016的每月長期資料,和同時期阿拉伯灣西部,沙烏地海域的表水溫做比較:
Lastly, i calculate the average monthly SST from 1982 to 2016 for waters around Taiwan, and compare those values with the western Arabian Gulf, the Saudi Arabian territorial waters in the Gulf:
 |
| The long-term monthly SST of waters around Taiwan (black line) and western Arabian Gulf (red line) from 1982 to 2015. Error bars indicate the standard deviation. 從1982至2015,台灣附近海域(黑線)和阿拉伯灣西部(紅線)的每月平均表水溫變化圖 (誤差線表示標準差)。 |
台灣附近海域,相對於阿拉伯灣西部,有比較穩定的季節性海水溫。西部阿拉伯灣的環境,比台灣要更極端,最高溫較高,最低溫也較低,同時每月的溫度變化也較台灣高。
Compared to the western Arabian Gulf, the waters around Taiwan have relatively stable in terms of SST. The western Arabian Gulf exhibits more extreme environment, with higher monthly maximum, and lower monthly minimum, as well as higher variation within a month.
這些圖我想應該還粗糙的,但主要想表達原來開放資料和開源軟體這麼強大。以前可能要用很專業的付費軟體分析,但是現在用網路上的可靠資源,就可以在短時間內做出很不錯的結果。Although these plots may be still rough, it is still very incredible that one can use open-source data and freeware, instead of paid professional software, to make such interesting figures!